
Spring 2025

Social Determinants of Health at the Population-Level: A Geospatial Success Story
Liane M. Ventura MPH1; Nusrat Sheba MPH2; Sarah Watters PhD3; Jennifer Mandelbaum PhD, MPH4; Persad-Clem, Reema PhD, MPH5; Benjamin Brown MD, MPH2 - Population Health Sciences SIG
Social Determinants and Population-Level Health
Population-level health disparities are inextricably linked to inequities in “the conditions in which people are born, grow, work, live, and age, and the wider set of forces and systems shaping the conditions of daily life.”1 Referred to as social determinants of health (SDOH), these conditions include access to sufficient amounts of healthy food, quality education, health care, safe neighborhoods, economic earning potential, and enriching social communities. Social determinants of health are upstream factors influencing population-level health outcomes and can be either protective or risk factors.2
Geographic information system (GIS) technology can be used to enable the spatial representation of population-level data, including SDOH metrics (e.g., social deprivation indices, rural/urban designation, and health insurance rates). Spatial representation provides important context for health improvement efforts to better address SDOH at sub-national and local levels.3 For example, a state-level Aging Data Dashboard and county-level Quality of Life Explorer. Below is an example of how researchers applied a community-engagement approach to co-develop a state-level GIS dashboard.
A GIS Success Story
The North Carolina Maternal and Child Health Dashboard was developed by researchers at East Tennessee State University to support policy making and public health improvement in Western North Carolina, an area characterized by high rates of infant mortality and preterm birth. The goal of the project was to examine maternal and child health outcomes within the context of income disparities and less-studied SDOH (e.g., transportation and broadband access) at the county and census tract levels across the state. Secondary data for the dashboard were curated from multiple sources including the U.S. Census Bureau, Human Resources and Services Administration, North Carolina State Center for Health Statistics, and March of Dimes.
During dashboard development, researchers hosted two Community Engagement Studios with public health practice partners, who recommended SDOH measures based on their work in the community, including the number of licensed OB/GYN physicians per 100,000 people, as a measure of healthcare accessibility, grandparents as caregivers, rental and mortgage burden, and sexual assault and domestic violence resources. Practice partners also emphasized the need for a Summary Tab to present key county-level metrics in one place.
Additionally, practice partners discussed how the GIS tool could be used to support policy change and programmatic efforts. Notably, practice partners emphasized the importance of identifying and further investigating “bright spots” throughout the region/state to understand protective factors, impactful programs, and foster collaboration. The benefit of the GIS tool for supporting health equity initiatives was also emphasized due to the striking visuals and readily accessible data points.
Call to Action
The visualization of population-level SDOH metrics advances public health decision-making, planning, policy, and practice. GIS tools can provide a visual and real-time frame of reference for practice partners and policy makers to identify health-related needs.4 Interdisciplinary collaboration and community-engaged approaches are productive strategies for investigating the contextual nuance that underlies population-level health disparities. The Society of Behavioral Medicine supports this work with Special Interests Groups that foster interdisciplinary collaboration, advocacy efforts, and Science Communication Toolkits.
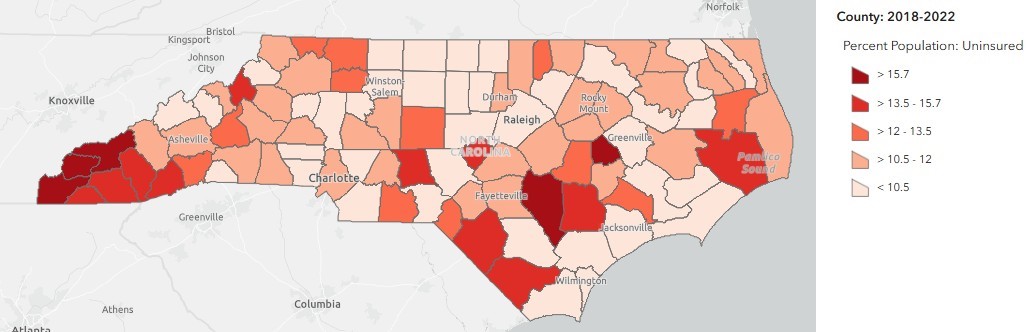
This image is of the county-level rates of individuals with no health insurance throughout North Carolina whereby darker colors represent higher rates of uninsured individuals.
Acknowledgements
We would like to thank the dashboard development team at East Tennessee State University and all the practice partners in Western North Carolina who made this work possible.
Affiliations:
- University of North Carolina at Charlotte
- University of Utah
- 50 West (Behavioral Scientist)
- athenahealth, Tufts University
- Arcadia University
References:
- World Health Organization (2022) Social determinants of health. Available at: https://www.who.int/health-topics/social-determinants-of-health#tab=tab_1.
- Fitzpatrick SL. Social Determinants of Health, Social Risks, and Social Needs: What’s the Difference and How Do You Measure Them?(2022). https://www.sbm.org/publications/outlook/issues/summer-2022/social-determinants-of-health-social-risks-social-needs-whats-the-difference-how-do-you-measure-them/full-article
- Molla YB, Rawlins B, Makanga PT, et al. Geographic information system for improving maternal and newborn health: recommendations for policy and programs. BMC Pregnancy and Childbirth. 2017;17(1):26. doi:10.1186/s12884-016-1199-y
- Detres M, Lucio R, Vitucci J. GIS as a Community Engagement Tool: Developing a Plan to Reduce Infant Mortality Risk Factors. Maternal and Child Health Journal. 2014;18(5):1049-1055. doi:10.1007/s10995-013-1337-3